Reporting is available onsite (within the iPad app) and online (in the LRS Connect web portal). Onsite reporting is designed for store managers to quickly review recent performance information. More customizable reporting is available at LRS Connect, here is a link. Read more about reporting on LRS Connect here.
Access reporting for your restaurant by tapping on the Menu icon at the top left and then select Reporting. In the drop down, you can see any of the following 8 reports:
Delivery Time by Day
This report displays the amount of time between when trackers start and they are cleared, see average delivery time by day and identify trends for today, yesterday, the past week or the past two weeks.
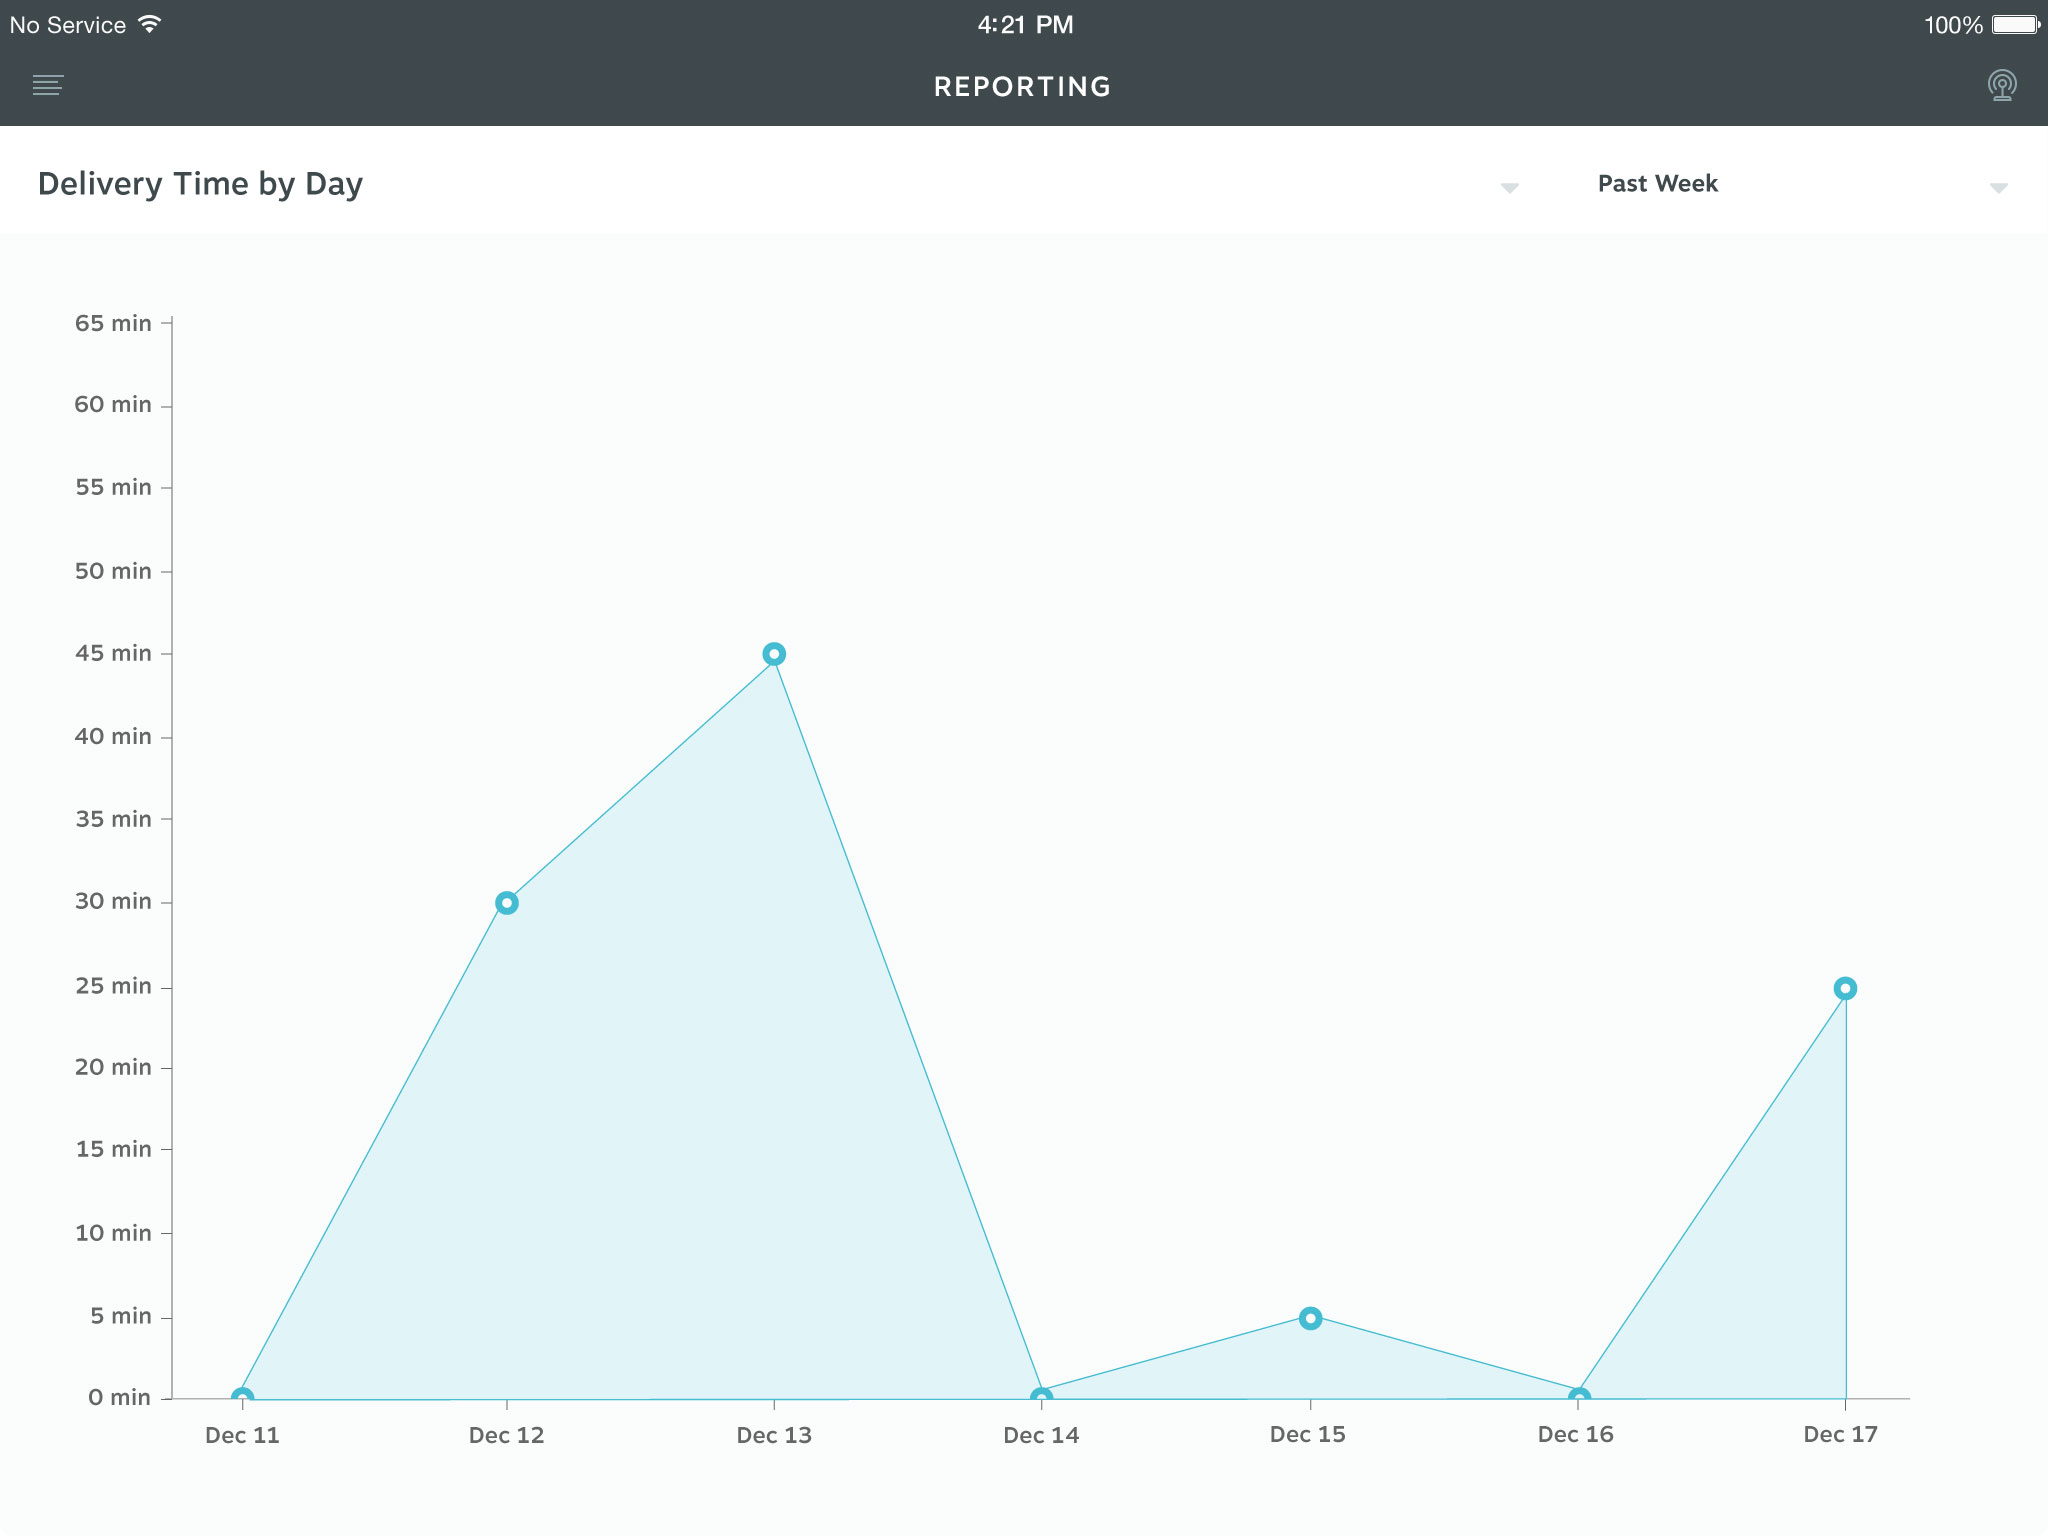
An example of reporting for the past week using Delivery Time by Day
Delivery Time by Week Day
This report displays the amount of time between when trackers start and they are cleared, see trends associated to days of the week for example, identify longer delivery times during the weekend.
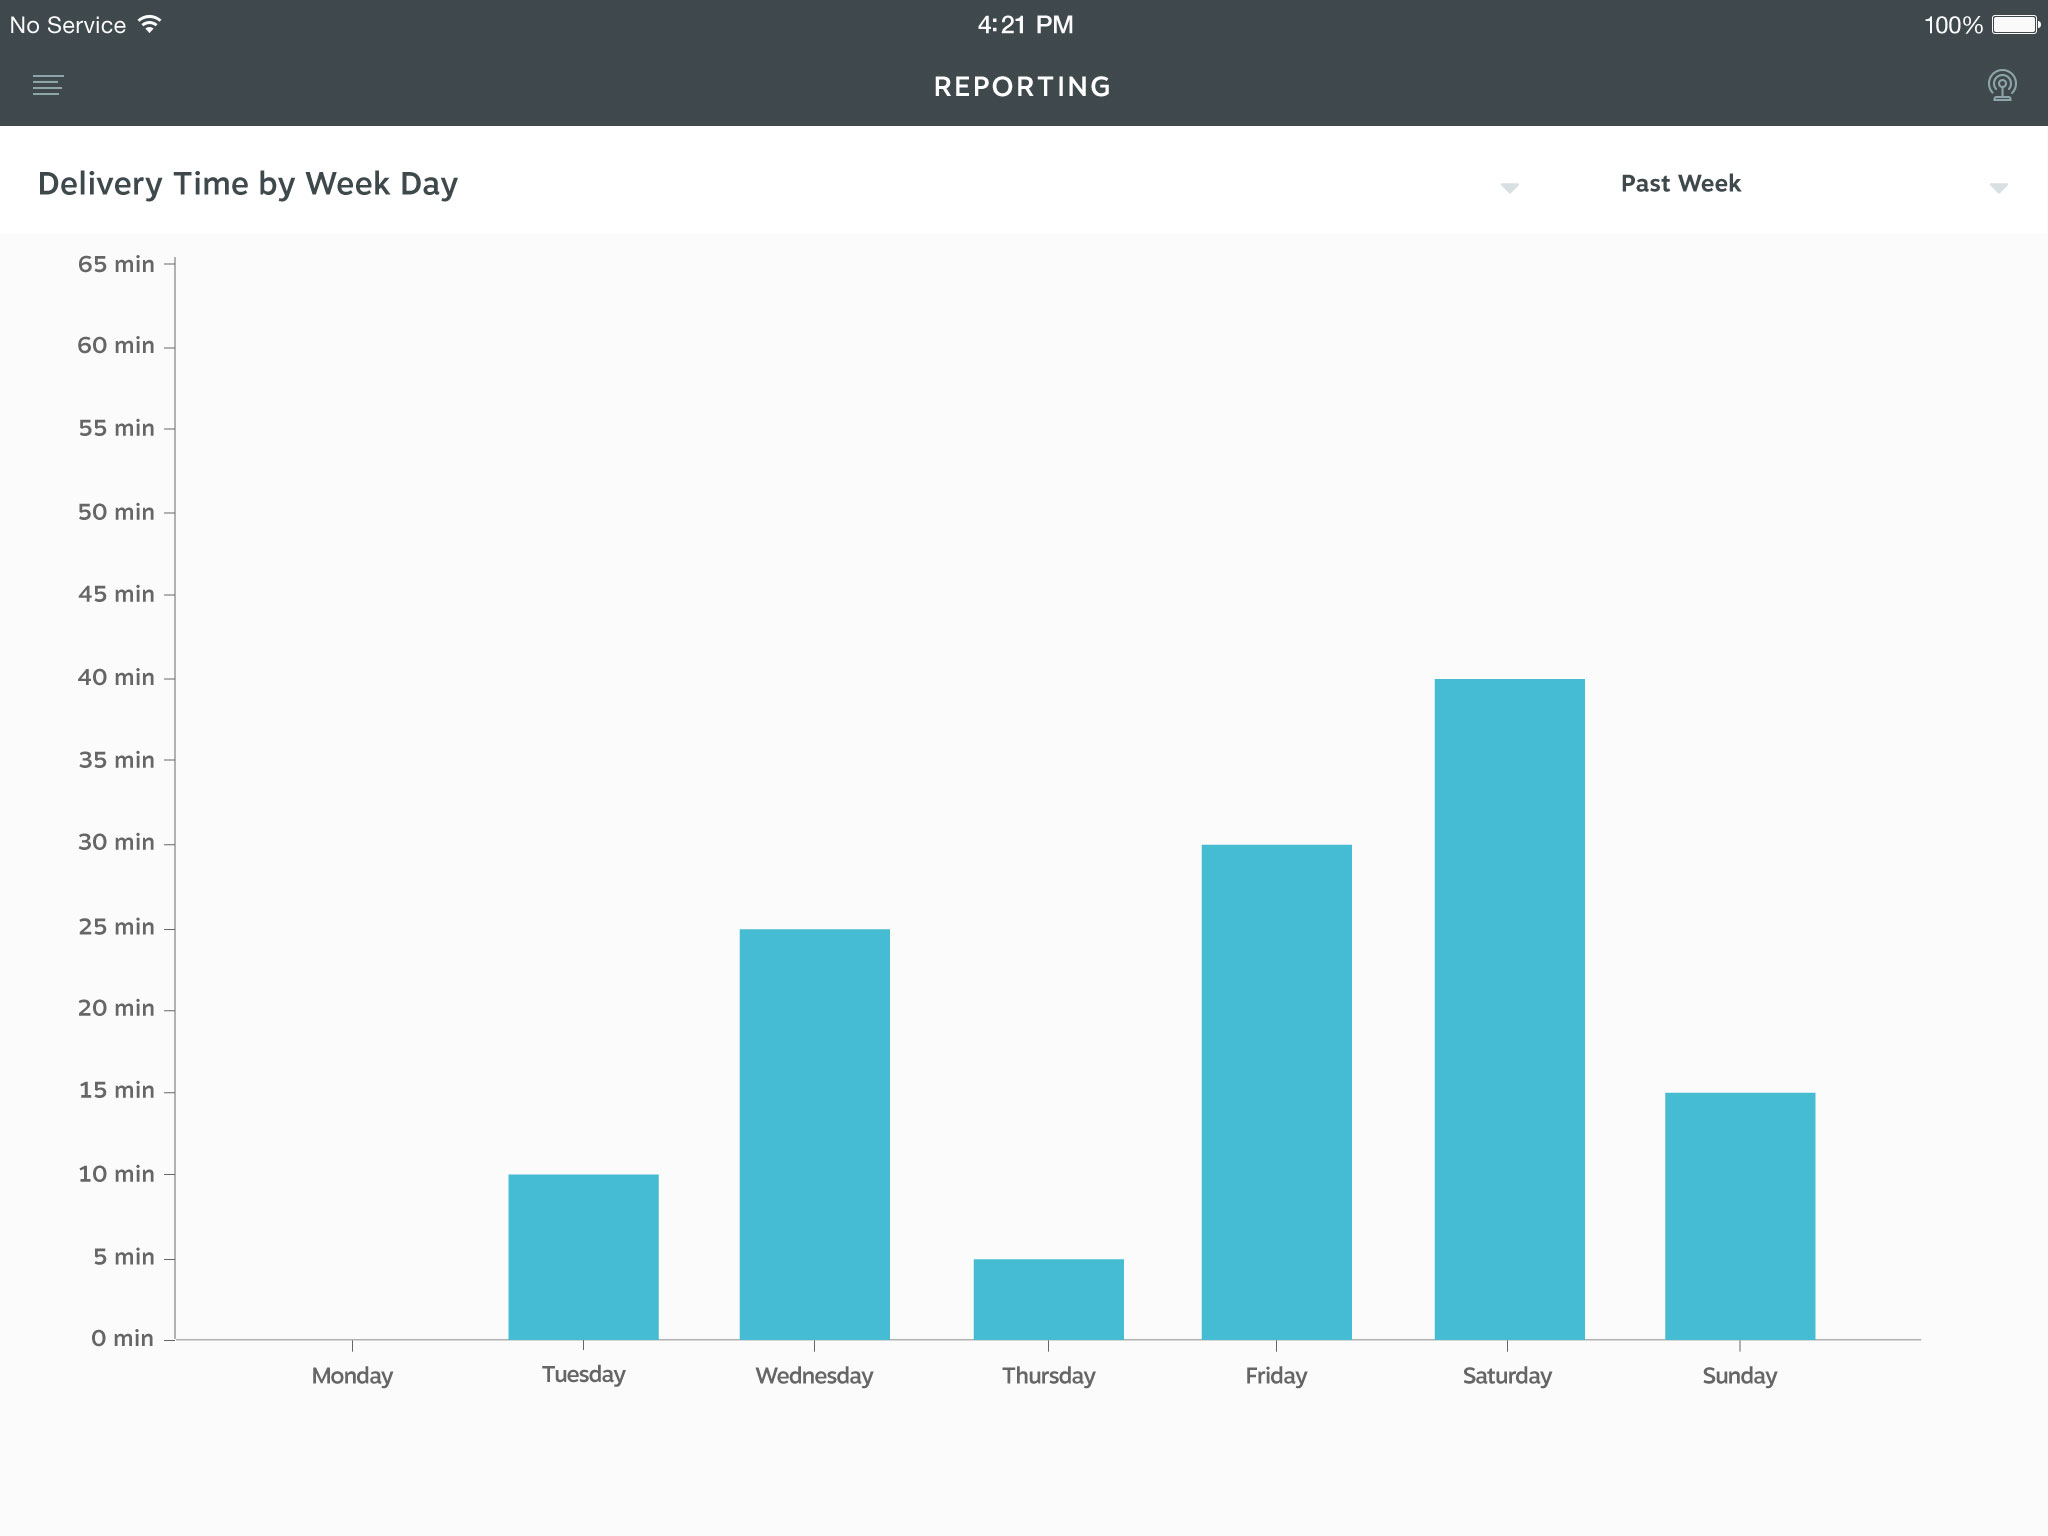
An example of reporting for the past week using Delivery Time by Week Day
Delivery Time by Hour of Day
This report displays the amount of time between when trackers start and they are cleared, see delivery time trends by time of the day. For instance you can identify delivery times trends for lunch versus dinner.
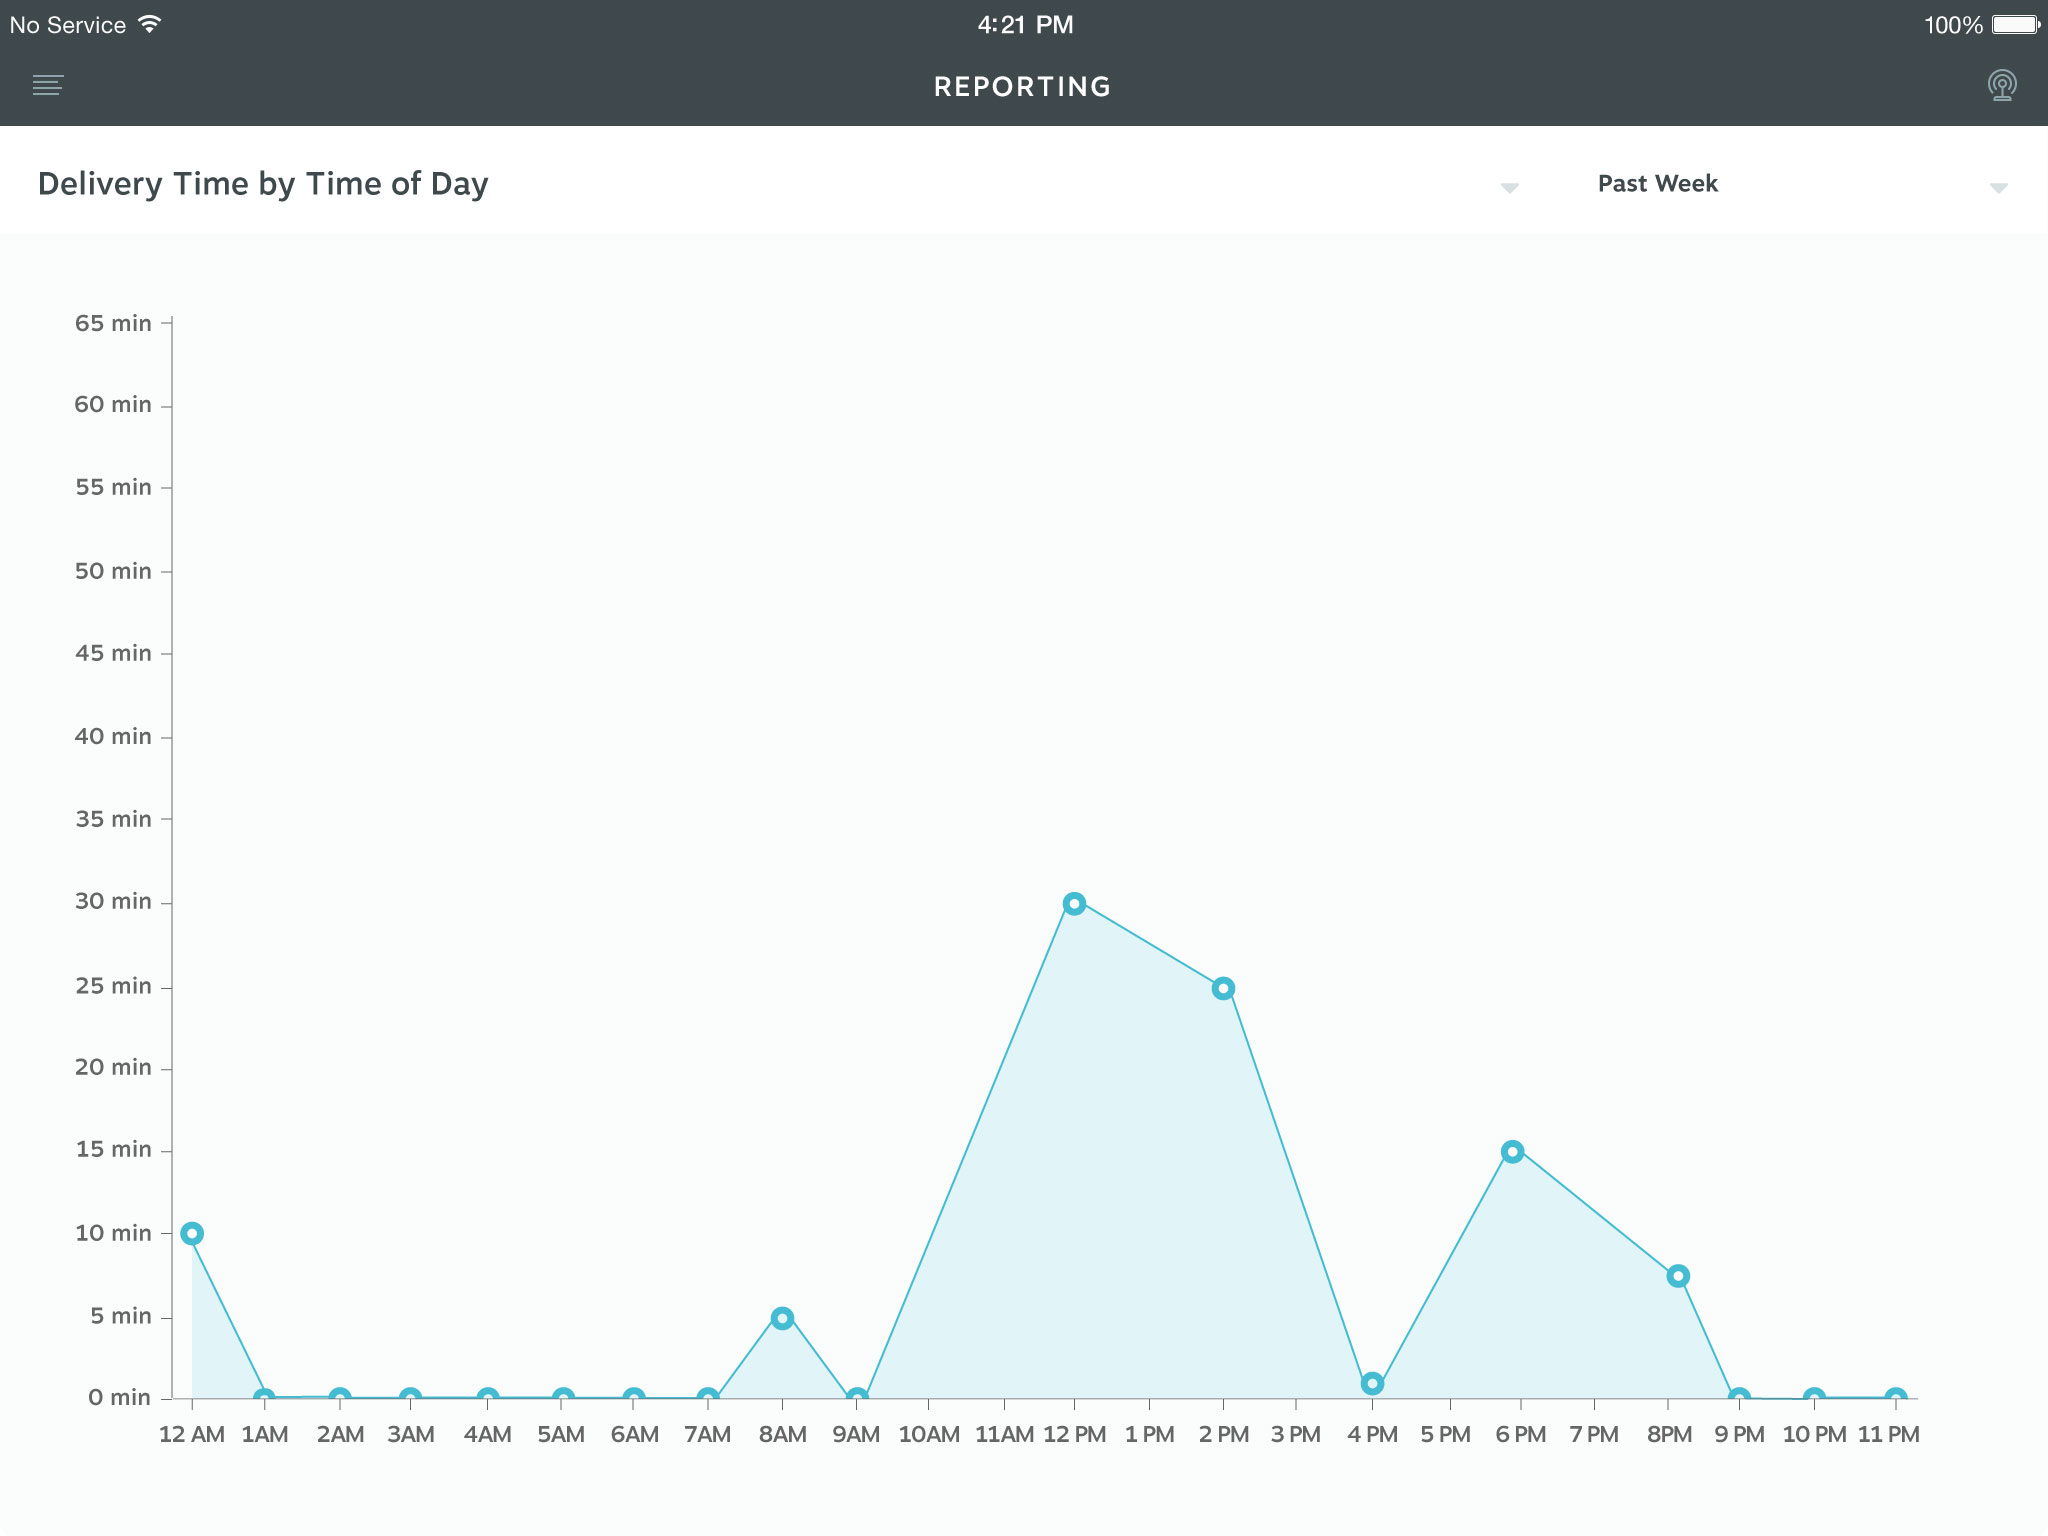
An example of reporting for the past week using Delivery Time by Time of Day
Dine-in and To-Go Orders by Time of Day
This report shows the total number of orders received each hour of the day, separating how many were dine-in orders vs. to-go orders. This offers the operation insight into the volume of orders and trends of to-go vs. dine-in customers.
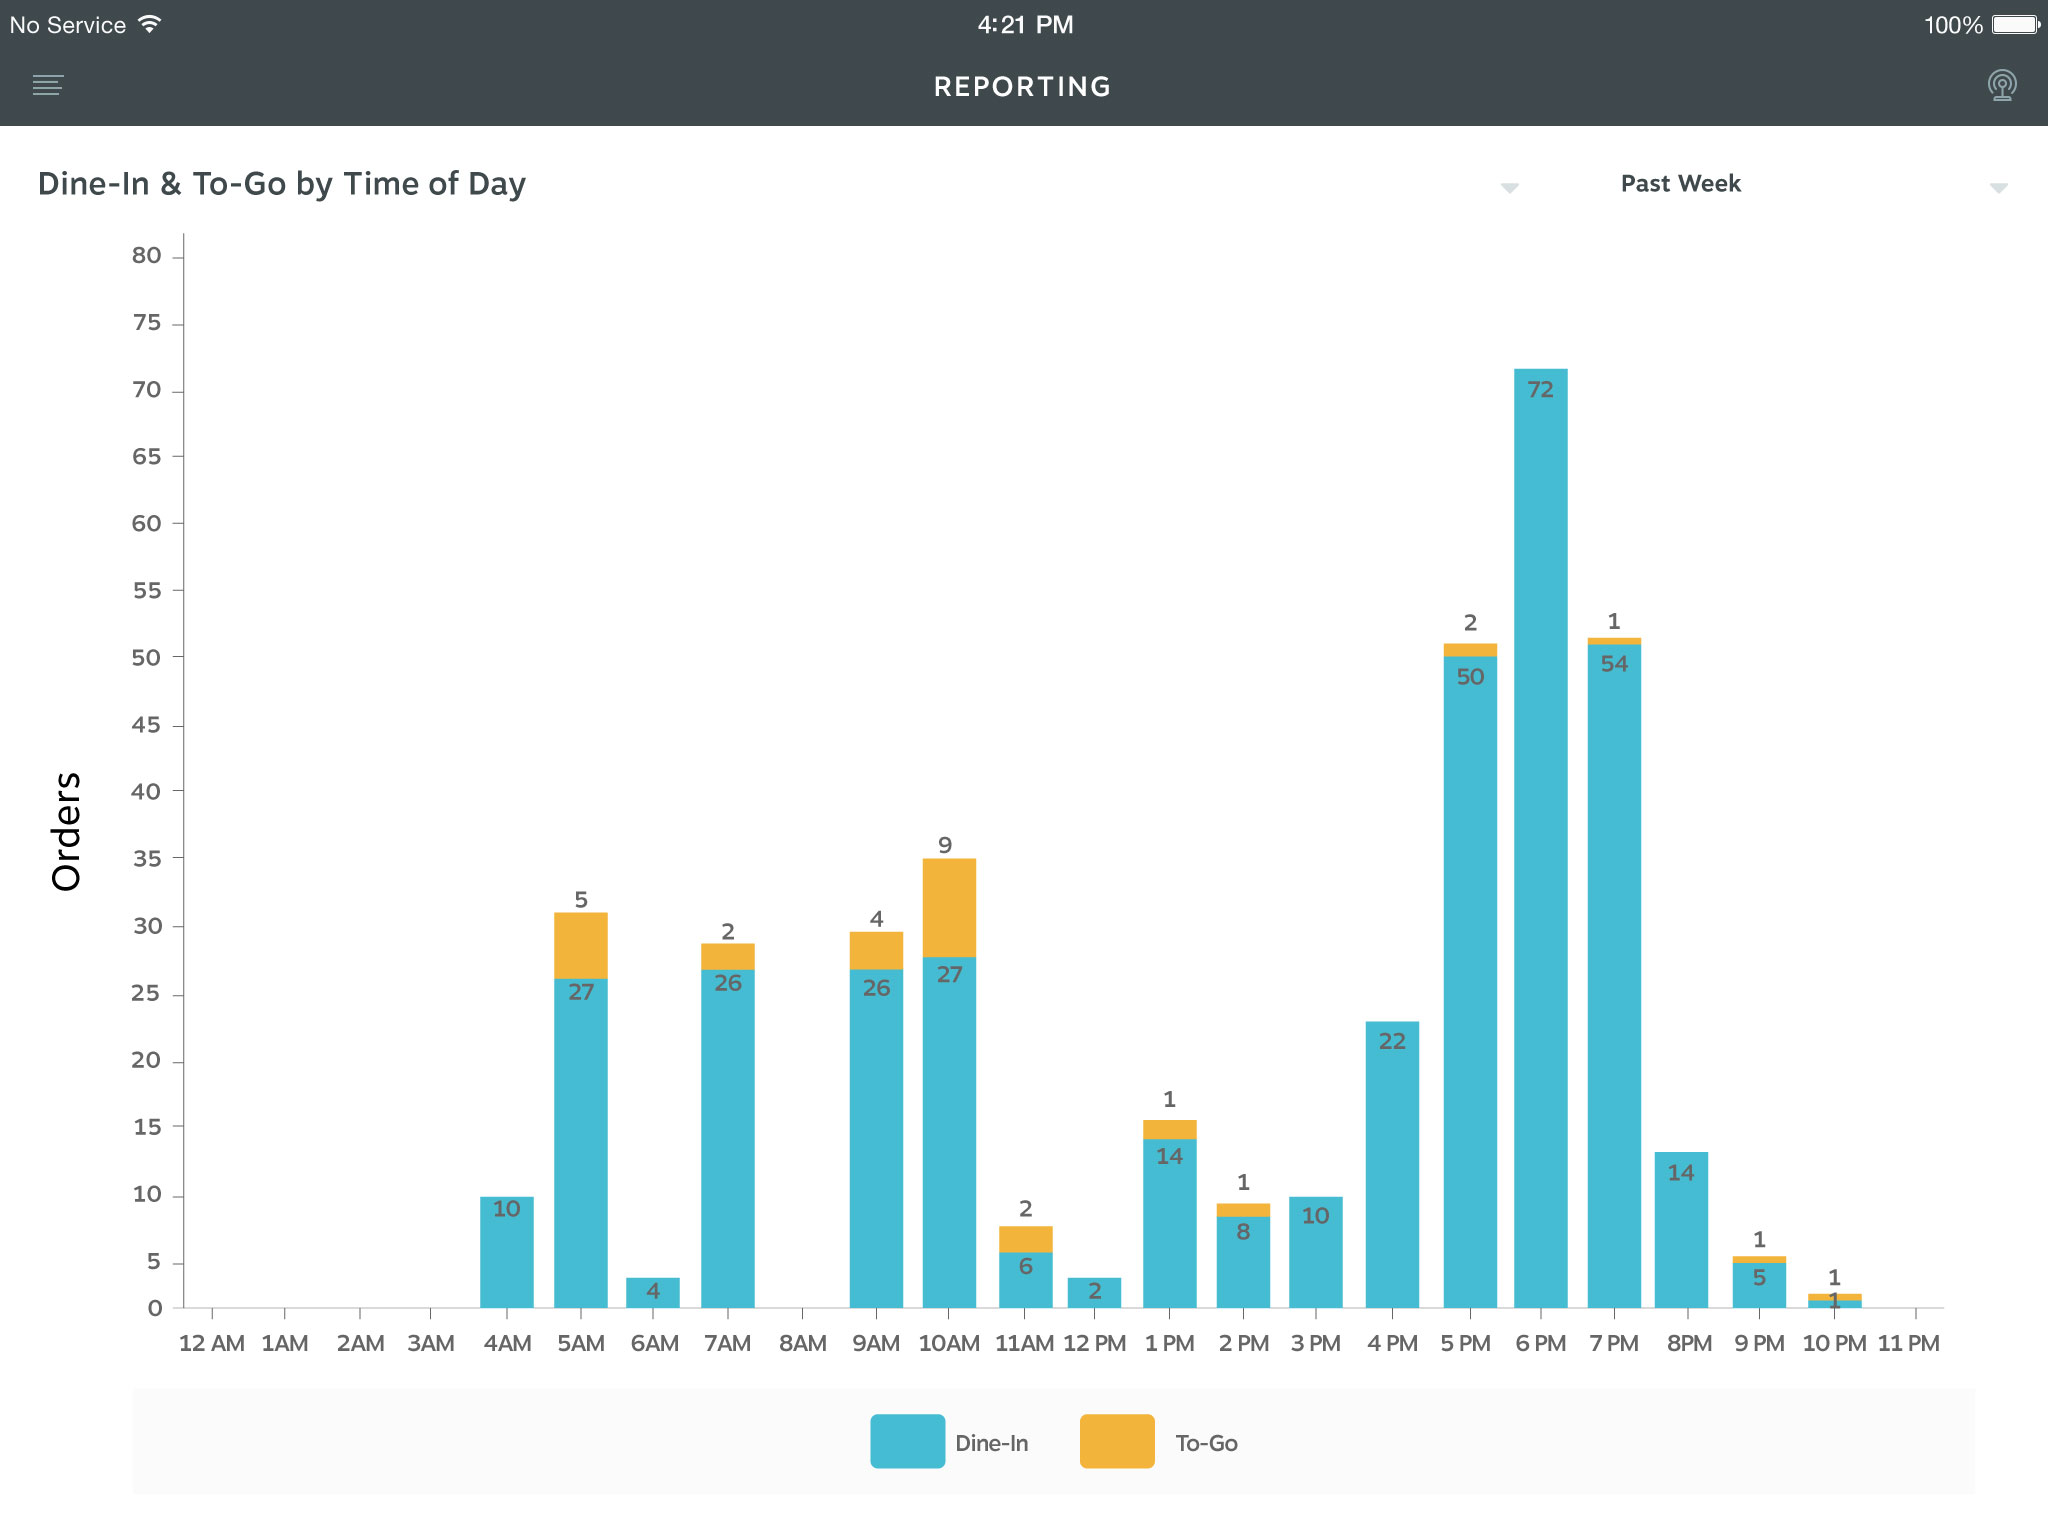
An example of reporting for the past week using Dine-In & To-Go by Time of Day
% Goal Met by Day
This report displays the percentage of orders delivered that met the set goal during the selected time range and quickly identify recent trends and compliance to goal. Note: this report type is not available at LRS Connect, it is only available on the iPad.
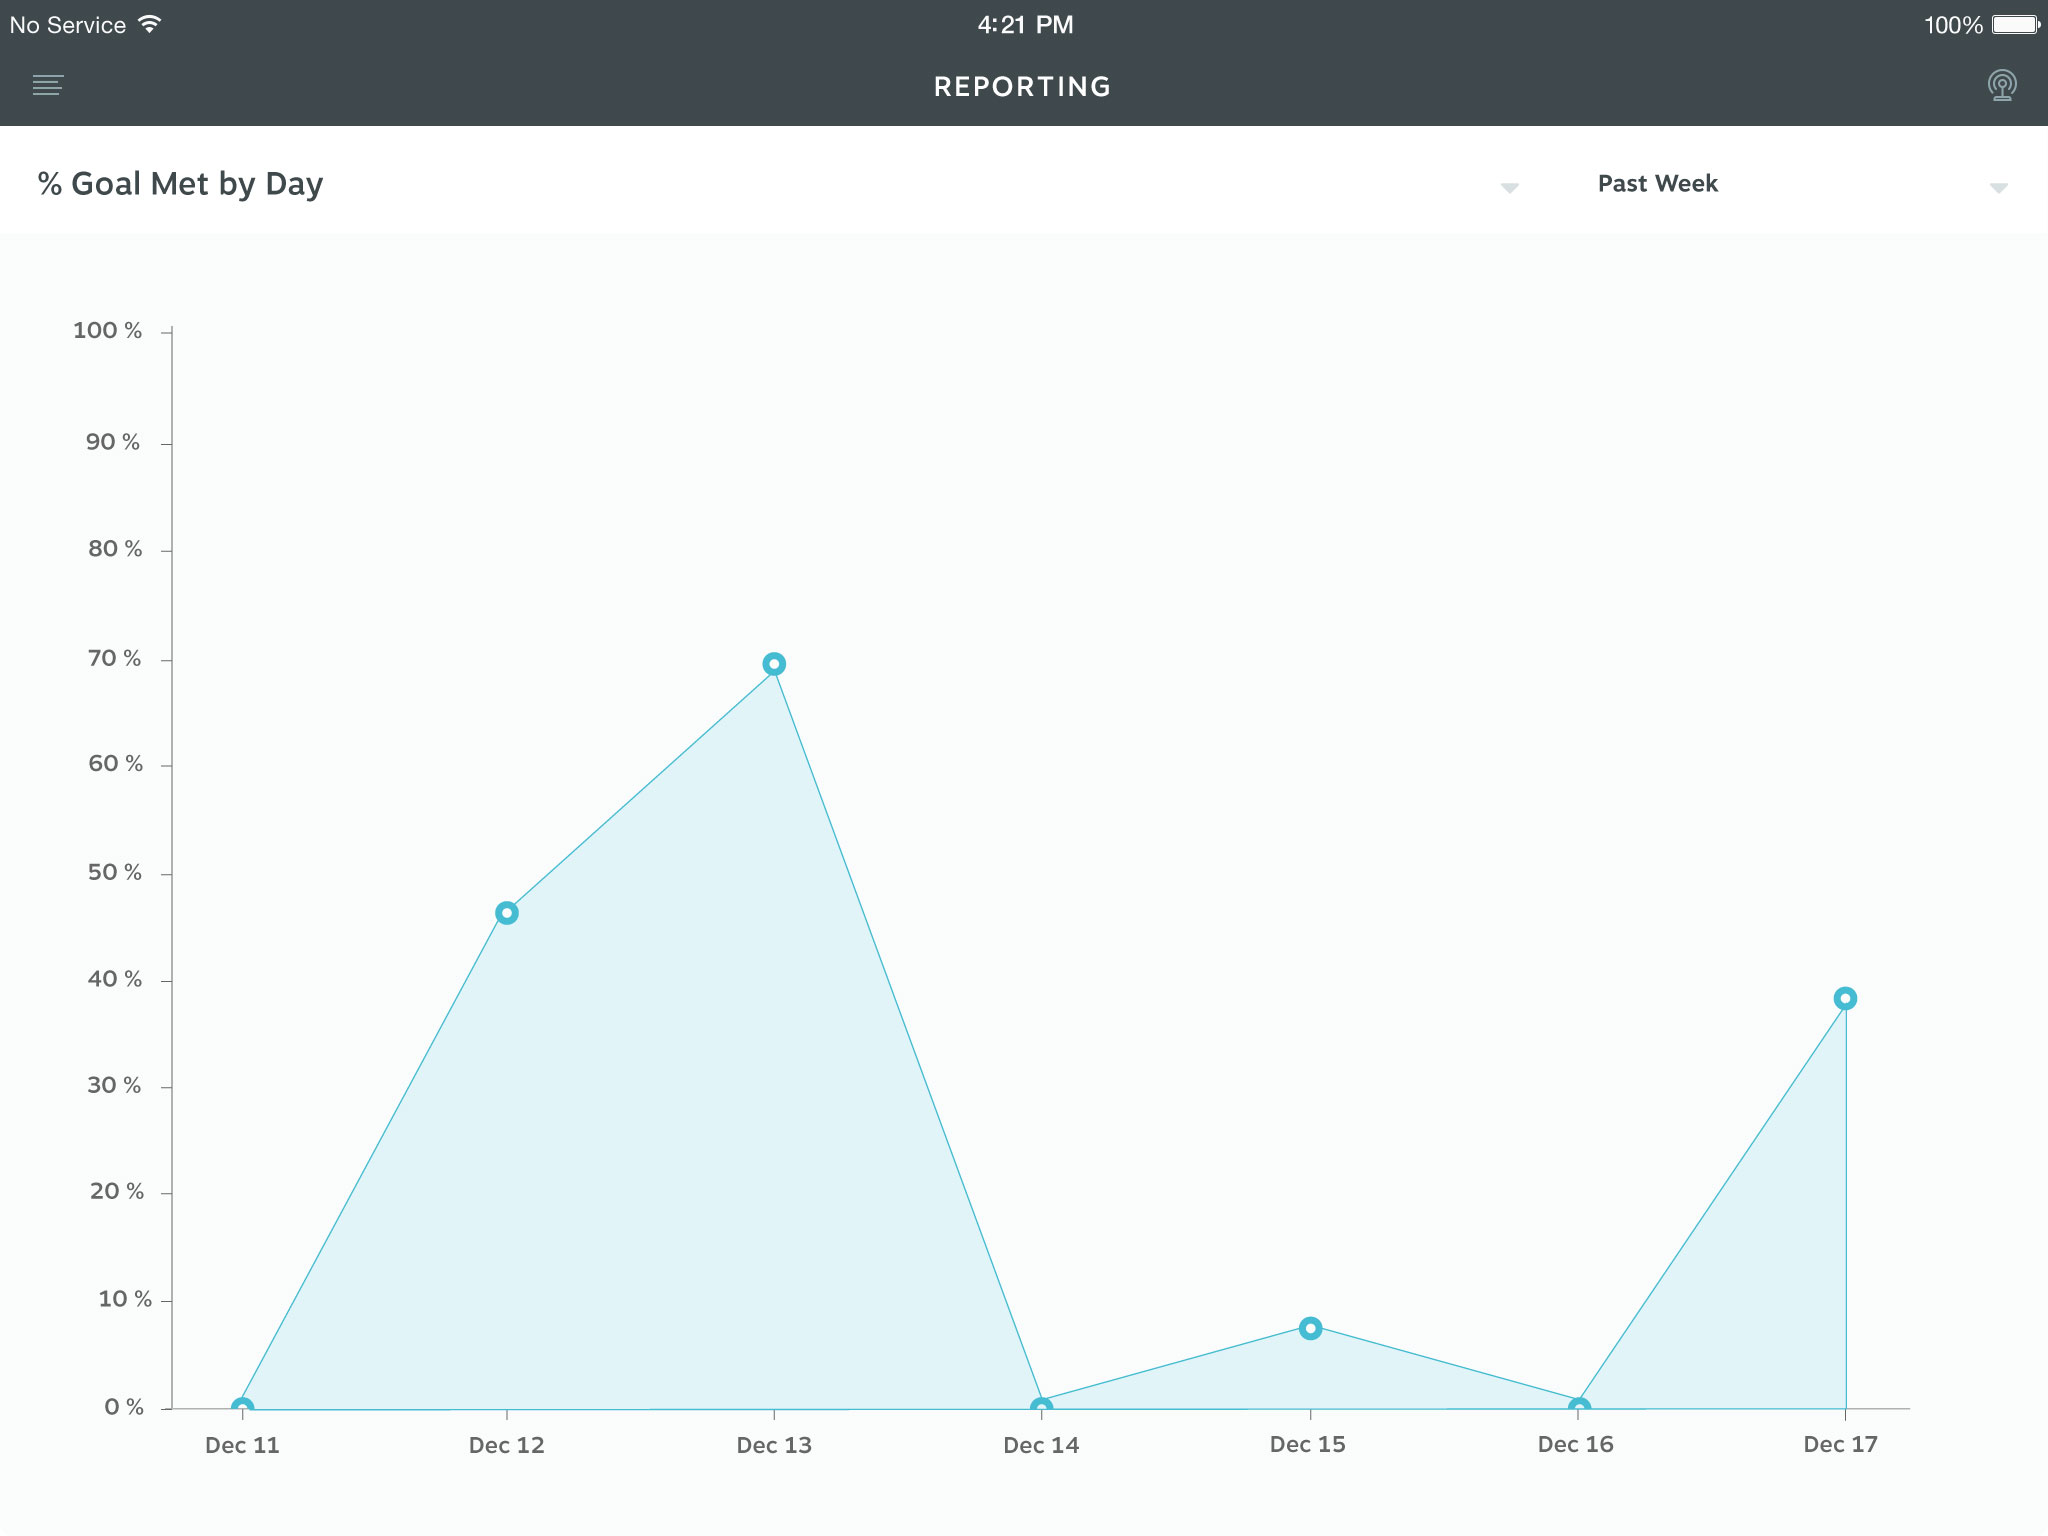 An example of reporting for the past week using % Goal Met by Day
Orders by Week Day
This report shows the total number of orders received each day, separating how many were dock vs. manually cleared orders. This offers the operation a quick view of orders volume and the integrity of their reported delivery time.
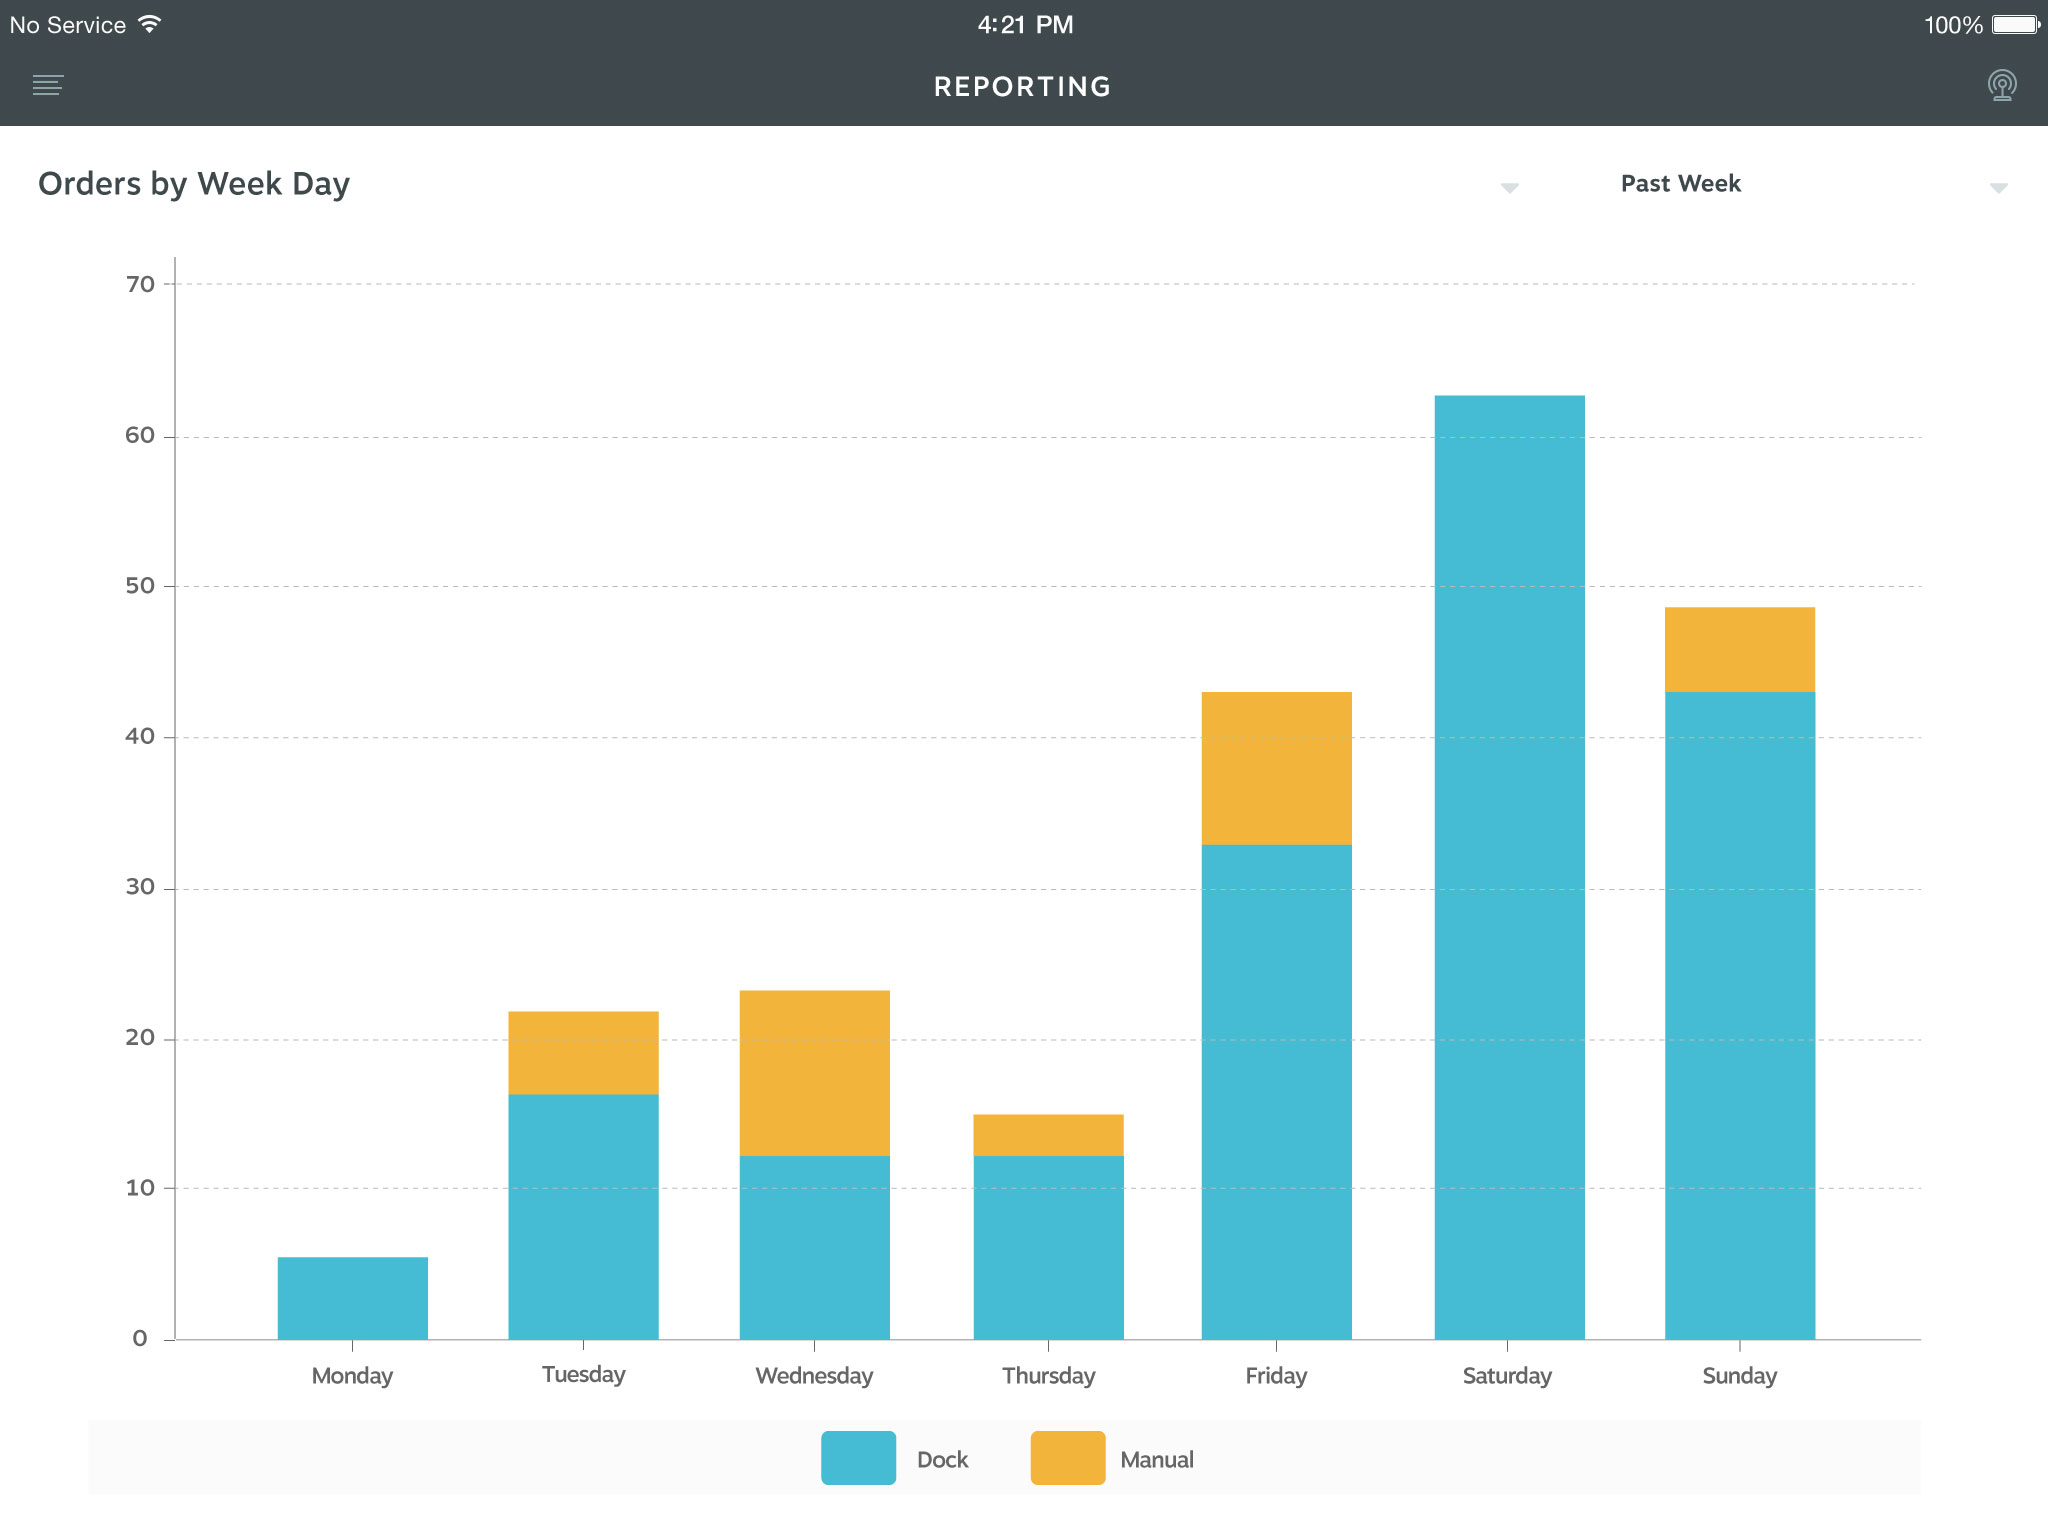
An example of reporting for the past week using Orders by Week Day
Table Utilization
View the number of seatings per table to identify the most popular sections and plan your staff and layout accordingly.
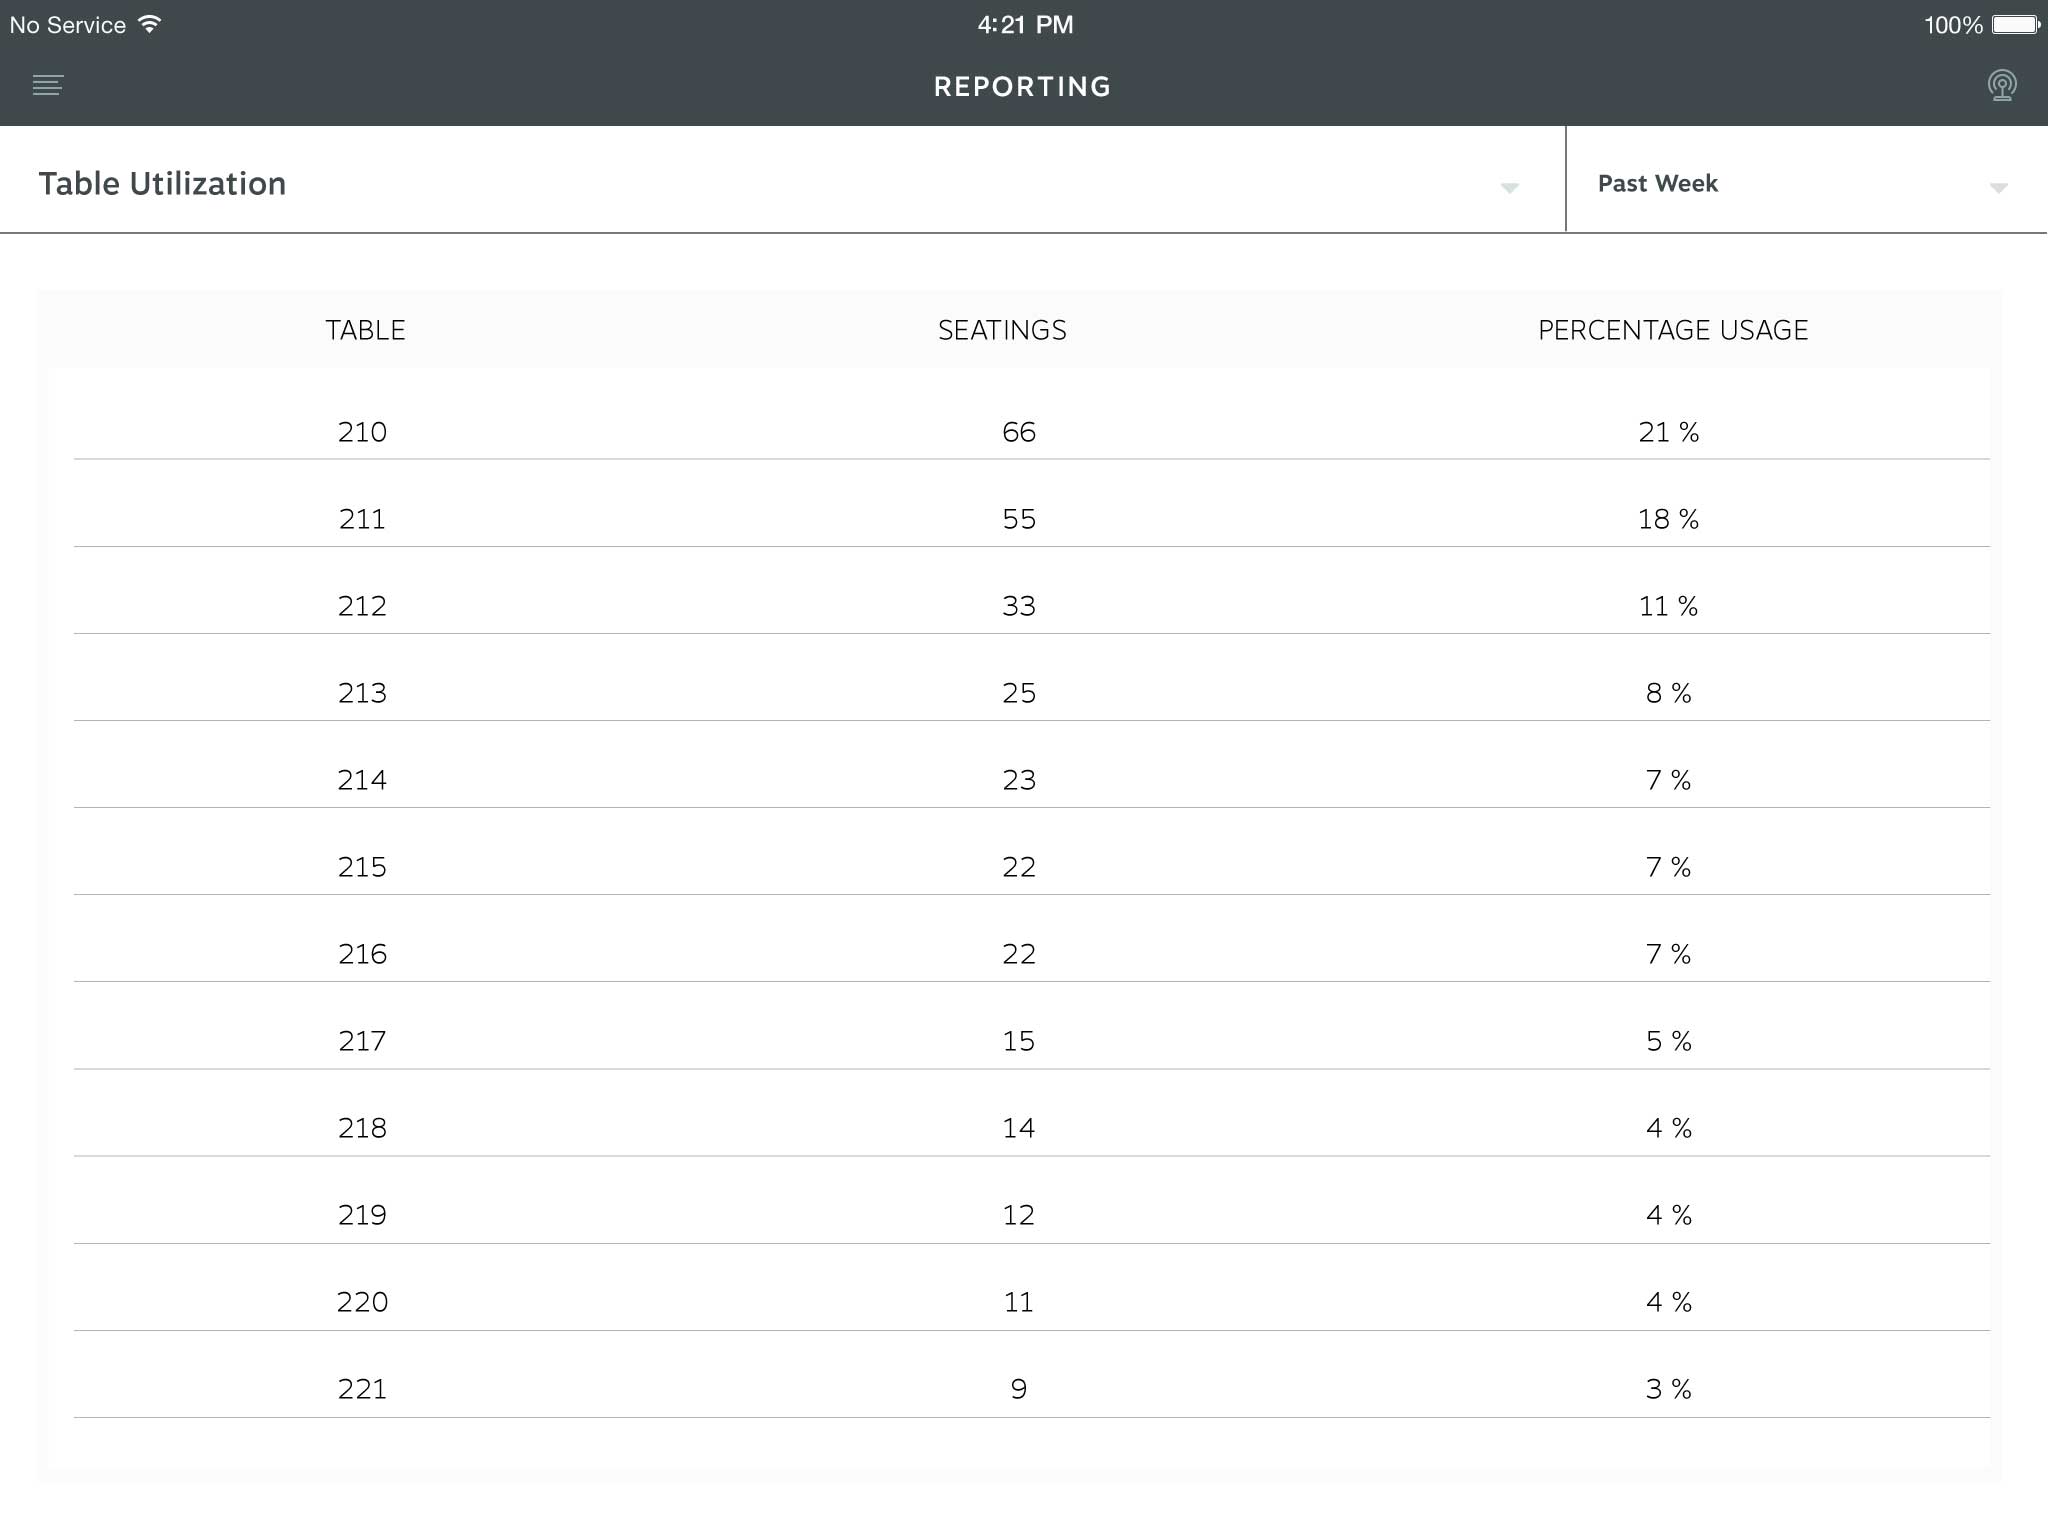
An example of reporting for the past week using Table Utilization
Time to Sit by Time of Day
This report displays the amount of time between when trackers start and read a table location, offering insight into the lapsed time between when customers place and order and find a table. Any orders that don’t ultimately get assigned a location (like to-go orders) are excluded from this report so the data is not skewed.
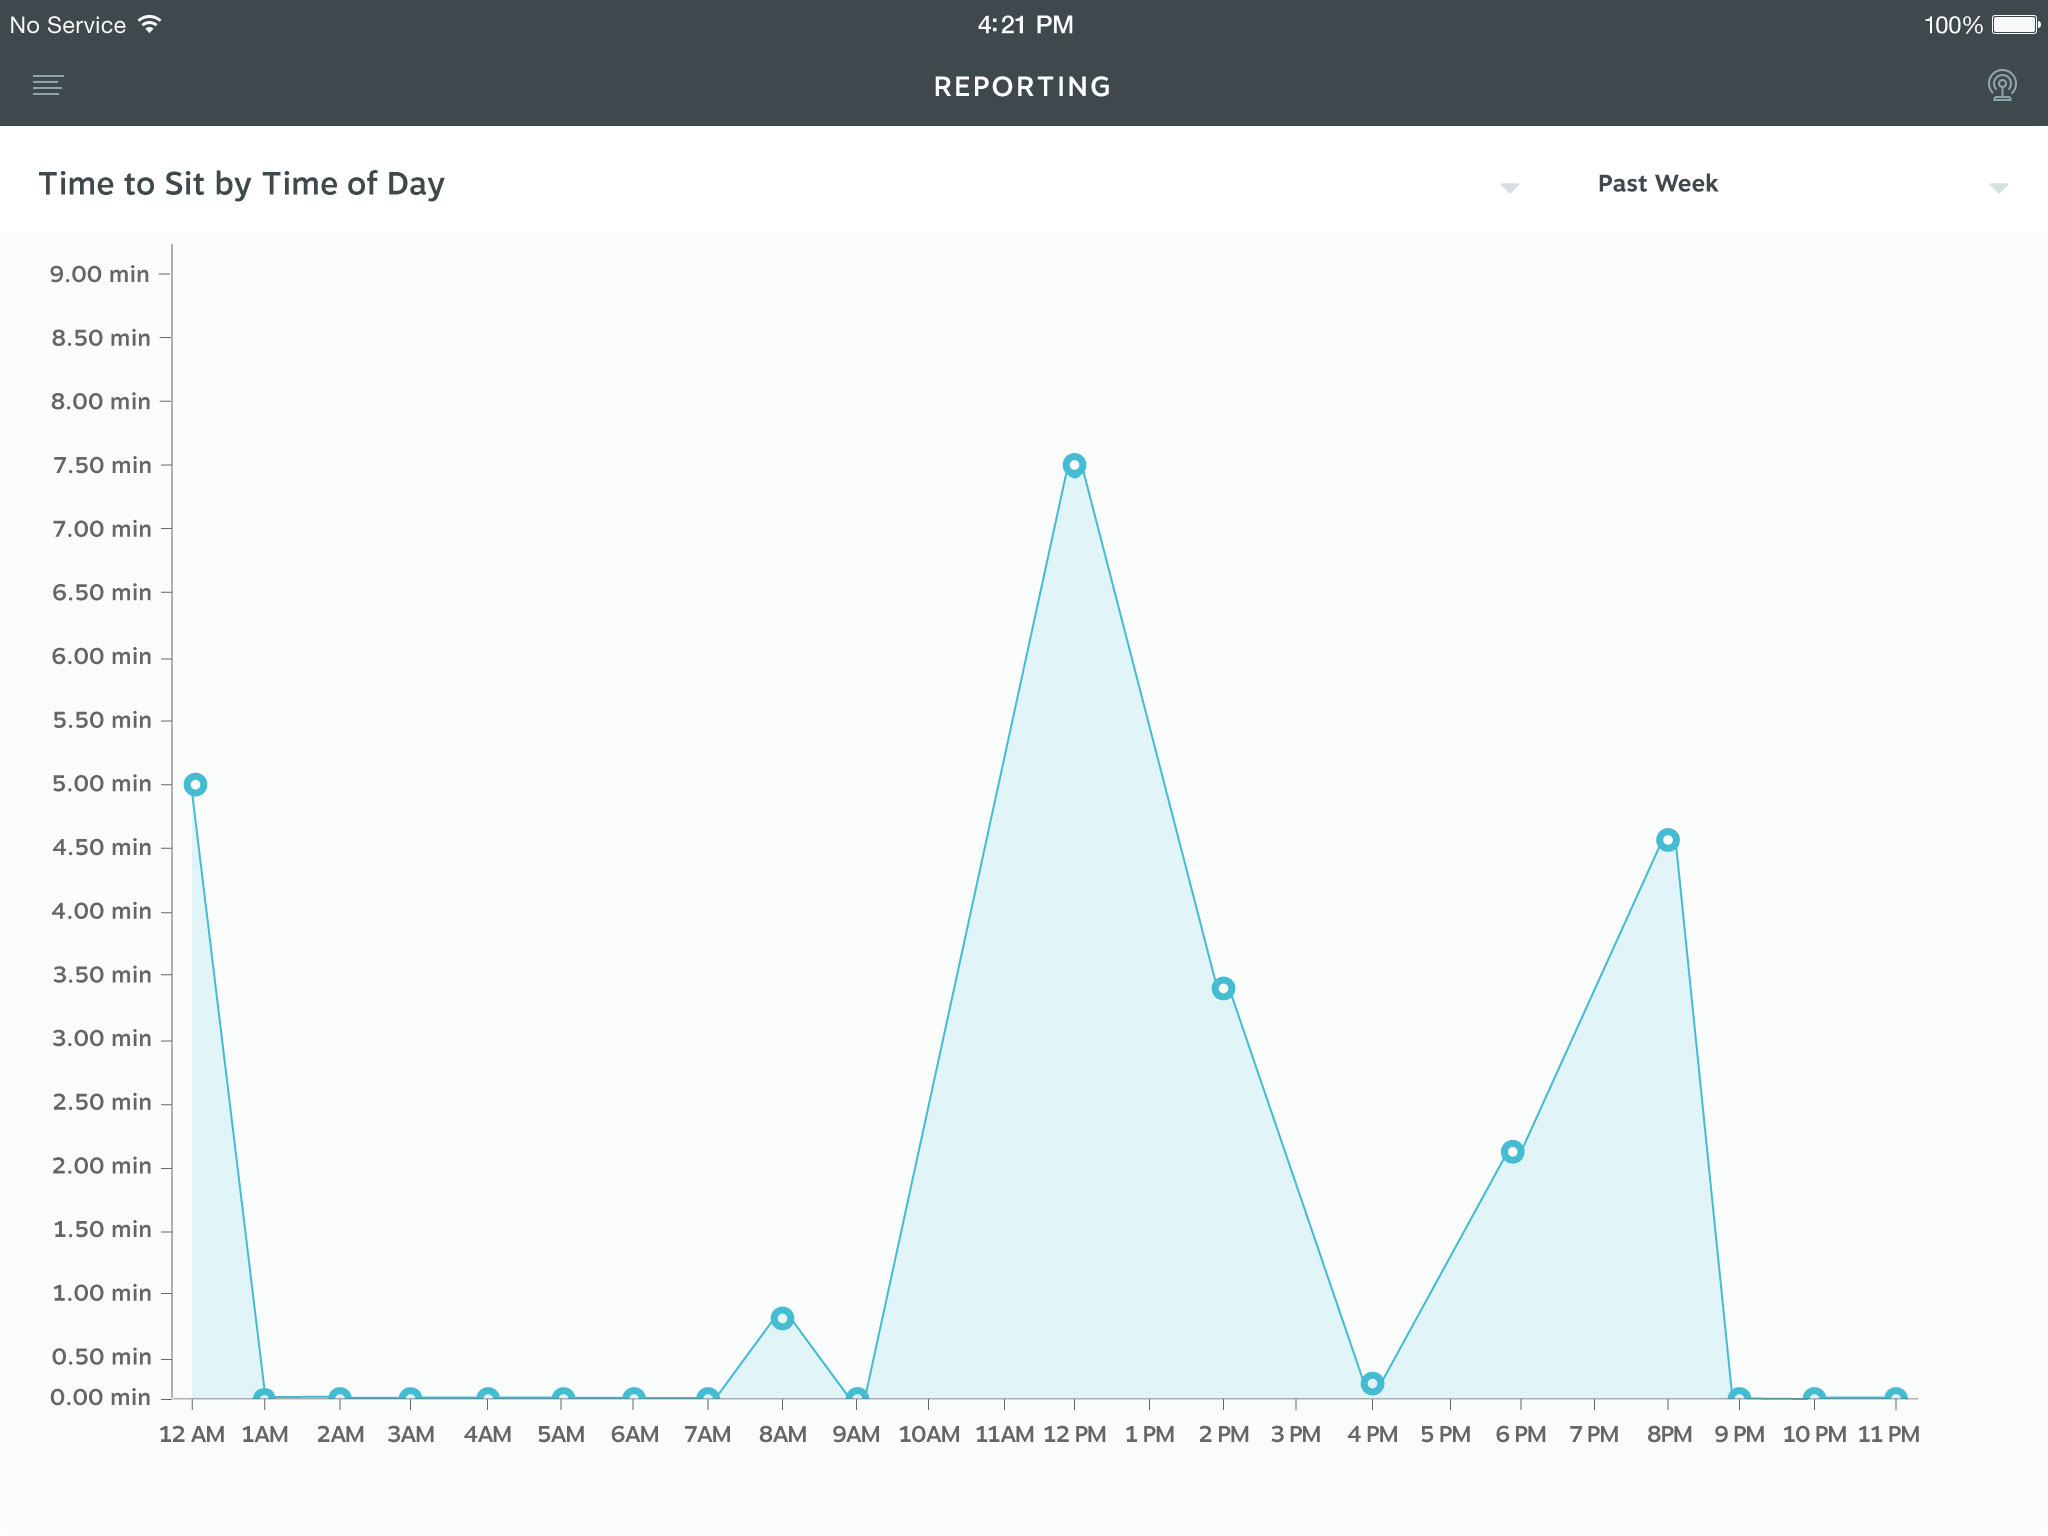
An example of reporting for the past week using Time to Sit by Time of Day
Date Range
There are four possible date range selections on the top right drop down:
- Today
- Yesterday
- Past Week
- Past 2 Weeks