To access in depth reporting, compare locations and export a csv file with raw data log in to LRS Connect. Reporting is also available onsite in the app on the iPad.

Log in to LRS Connect screen.
Select Reporting on the top menu bar. View your data in 8 different reports. Each one of these reports allow you to get different insights into your restaurant. Click on the reports dropdown next to your account's name to navigate to each report.
Delivery Time by Day
This report displays the amount of time between when trackers start and they are cleared, see average delivery time by day and identify trends for today, yesterday, the past week or the past two weeks.

An example of reporting for the past week using Delivery Time by Day
Delivery Time by Week Day
This report displays the amount of time between when trackers start and they are cleared, see trends associated to days of the week for example, identify longer delivery times during the weekend.

An example of reporting for the past week using Delivery Time by Week Day
Delivery Time by Time of Day
This report displays the amount of time between when trackers start and they are cleared, see delivery time trends by time of the day. For instance you can identify delivery times trends for lunch versus dinner.

An example of reporting for the past week using Delivery Time by Time of Day
Dine-in and To-Go Orders by Time of Day
This report shows the total number of orders received each hour of the day, separating how many were dine-in orders vs. to-go orders. This offers the operation insight into the volume of orders and trends of to-go vs. dine-in customers.

An example of reporting for the past week using Dine-In & To-Go by Time of Day
Orders by Weekday
This report shows the total number of orders received each day, separating how many were dock vs. manually cleared orders. This offers the operation a quick view of orders volume and the integrity of their reported delivery time.

An example of reporting for the past week using Orders by Week Day
Orders and Delivery Time by Time of Day
This report shows the total number of orders received each hour of the day in columns, with a line displaying the average delivery time. This offers the operation a quick view of orders volume and the integrity of their reported delivery time.

An example of reporting for the past week using Orders by Week Day
Table Utilization
View the number of seatings per table to identify the most popular sections and plan your staff and layout accordingly.

An example of reporting for the past week using Table Utilization
Time to Sit by Time of Day
This report displays the amount of time between when trackers start and read a table location, offering insight into the lapsed time between when customers place and order and find a table. Any orders that don’t ultimately get assigned a location (like to-go orders) are excluded from this report so the data is not skewed.

Graph of locations selected for the Average Delivery Time by Day.
Select a report type and customize your views into these reports with these options:
Locations
You can see the All Locations view which pulls all locations together, or you can look at an individual location. Locations can be compared side by side, comparing values with each other, or can be compared with the All Locations value.
Date Range
The date range is fully customizable. When looking at a graph you can zoom into a period of time of more interest by clicking on the graph from left to right. This could give you a closer look into the delivery time fluctuations within the interest range.
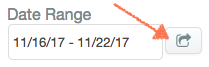
Export
Reports can be exported as a csv file enabling additional data manipulation by clicking on the button with an arrow next to the Date Range.